By Husain Ghadially
More than 1.2M GoFood daily orders are placed using search. While It’s great that GoFood has close to half a million merchants on its platform, it also presents a significant challenge to give users results that are most relevant to them. The problem is choice.

Our goal is to help users easily find the food or restaurant they are looking for, especially when their intent is clear. When the intent is not very clear, we would like to help users discover diverse options based on their searches.
One way to translate these search objectives into quantifiable measures can be done with nDCG. nDCG (explained further below) is a widely used and well defined search relevance measure.
Although much knowledge is available about nDCG in general, in this blog we explain product practicalities regarding measurement and interpretation of nDCG for driving better food search relevance. If you are interested in the tech behind this work, check out this article, where we talk about our architecture to personalise search results using elastic search and machine learning models.
Why is relevance important
The overall goal is to improve customer satisfaction. In GoFood search, the hypothesis is that higher search results relevance will lead to better conversion, which in turn will lead to more satisfied customers.

Customer satisfaction: There are many ways to measure whether customers are satisfied with their search experience. The most straightforward measure is to track whether the customer placed an order for the food or restaurant they searched for. This measure is an output metric or a lagging indicator of success.
Conversion: We hypothesise that driving higher search to order conversion will lead to more satisfied customers as measured above. Conversion here indicates the percentage of searches that led to an order. For example, if 100 user searches resulted in 30 GoFood orders, then the conversion is 30%.
Relevance: The input metric or leading indicator of success then is relevance. Simply put, relevance is a measure of how appealing search results are to users, as measured by the actions performed by the user against those results. Specifically, if a user clicked on, or ordered from that result.
What is that cryptic term — nDCG?
At Gojek we strongly believe in demystifying, simplifying, and breaking down complex problems. We do this to get anyone and everyone in the organisation to fully understand the problem and lean in to the solution. The more people that understand a problem, and the better they understand it, the better our solution will be.
A first step to get a pulse on this is, can you explain the most complex thing you are working on, from scratch, to a complete outsider who has no knowledge of product or technology? If you catch the drift, this blog is exactly that.
- nDCG is a commonly used relevance metric in the industry, used by major web search companies and data science competition platforms such as Kaggle
- It considers necessary real world parameters like an item having multiple levels of relevance and position of a relevant item in a list of results
- nDCG is a normalised value, hence it can easily compare entirely different sets of results against a common baseline. When aggregated, nDCG measures the effectiveness of the engine producing the results, rather than results themselves
What does it really mean, and how do we calculate it? ?
nDCG stands for normalised Discounted Cumulative Gain. As mentioned earlier, the formula construction is not within the scope of this blog. These details can be read about separately, but are not prerequisites to understand this blog.
nDCG calculates the Cumulative Gain of a set of results by summing up the total relevance of each item in the result set.

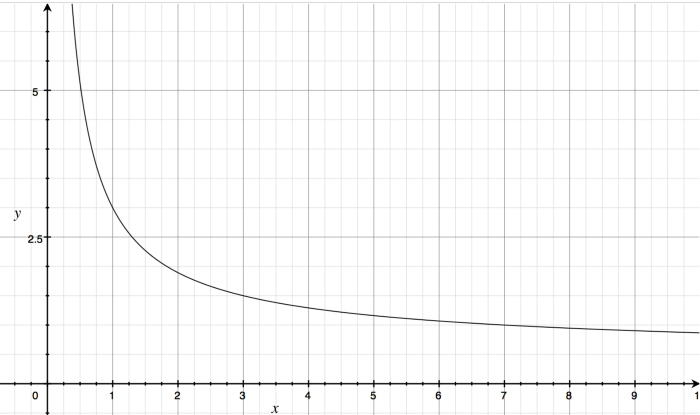
Then, the position of each item is discounted for, meaning the lower a relevant item is in the list, the higher the penalty or the discount that the item contributes to the total score. The cumulative gain calculation above is modified to a Discounted Cumulative Gain as shown below.

Here is a sample plot of DCG. It is important to note the shape of the graph. The plot indicates that as the position of a relevant item (x axis) goes lower in the list, the DCG score (y axis) drops off exponentially.

nDCG is dependent on telemetry. We assume the following user actions are tracked:
- Click: a user sees the details of a restaurant, such as the menu, address, etc
- Order: a user orders from a restaurant
Based on the above telemetry, we can measure the actual actions (clicks and orders) performed by the user, and compare them against the ideal sequence of the exact same results, that should have been presented to the user. This comparison is the normalisation mechanism.
Ideal results are those where the most relevant items are placed highest in the list of results. For this reason, the Ideal Discounted Cumulative Gain calculation is same as the DCG calculation, except that the list is first sorted by relevance, highest relevance first.


The proof is in the pudding
If the previous section was a little too academic, here’s an example of how we could calculate nDCG for a list of restaurants in GoFood search in the real world.
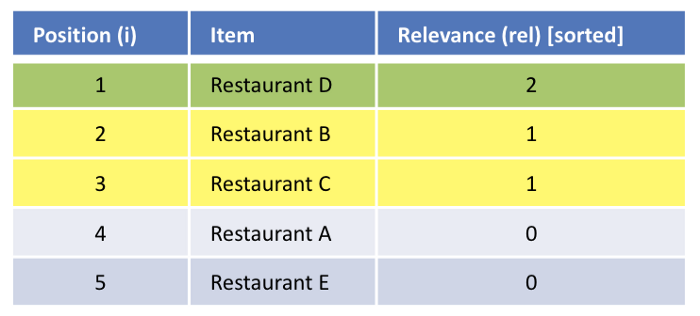
Assume the following list of restaurants

Let us track the following levels of relevance, for the list above.
0 = restaurant was listed
1 = restaurant was clicked
2 = restaurant was ordered from
We infer that an order has higher relevance than a click (more important), which in turn has higher relevance than a restaurant just being listed.
Using the DCG calculation described above, we get the DCG@5 value as 2.423. This value measures the relevance of the list of results based on what the user actually did.
Now, we sort the list based on relevance.

Using the IDCG calculation described above, we get the IDCG@5 value as 4.131. This value measures the relevance of the list of results based on what should have been ideally presented to the user, after knowing what s/he did.
Dividing the DCG by IDCG, we get the nDCG@5 value as 0.587. This value measures the relevance of this list of results and can be compared with others because it will always be in the range of 0 to 1.
Note: the nDCG calculation is usually limited to the ‘p’th item because calculating it for the entire result list could be computationally expensive. In addition, going further down in the list has diminishing returns because very few users actually see the entire list of results.
Great. Now what?
Now that we can calculate nDCG for an individual set of results, the value can be aggregated (averaged) across all results for all users. This gives an overall score — between 0 and 1 — of the how the search engine or results relevance is performing. By measuring nDCG, we can track it over time, and also set it as an objective to train our personalisation machine learning models. These machine learning models can re-rank the results to achieve higher nDCG values based on various user, restaurant, and other contextual parameters. For example, we could consider:
- user cuisine preference based on order history
- merchant popularity
- time of day, day of week
- weather
- seasonality factors such as festivals, holidays and so on
Taking this full circle, we hypothesised earlier in this blog that driving higher relevance will lead to better conversion which in turn will lead to more satisfied customers. Hence nDCG and results relevance is one of the key focus areas for GoFood search.
What do you think about how we approached this? How could we make results better? What additional things should we consider? Tell us in the comments below.


